Create Stunning Charts Online for Free with Livegap Charts
In today’s data-driven world, presenting information clearly is more important than ever. Whether you’re a student, a teacher, a business professional, or a data enthusiast, having the right tool to visualize your data can make all the difference. That’s where Livegap Charts comes in, a free, online chart maker that allows anyone to create beautiful, professional-looking charts without any software installation or registration.
Why Choose Livegap Charts?
One of the biggest challenges in creating charts is the complexity of traditional software. Many applications require installation, technical know-how, or even costly subscriptions. Livegap Charts simplifies this process by offering a browser-based solution that works on any device. Here’s why it stands out:
- Completely Free: No hidden fees, no trial periods, no registration required. You can start making charts immediately.
- User-Friendly Interface: The intuitive design ensures you can create charts in minutes, even if you have no prior experience.
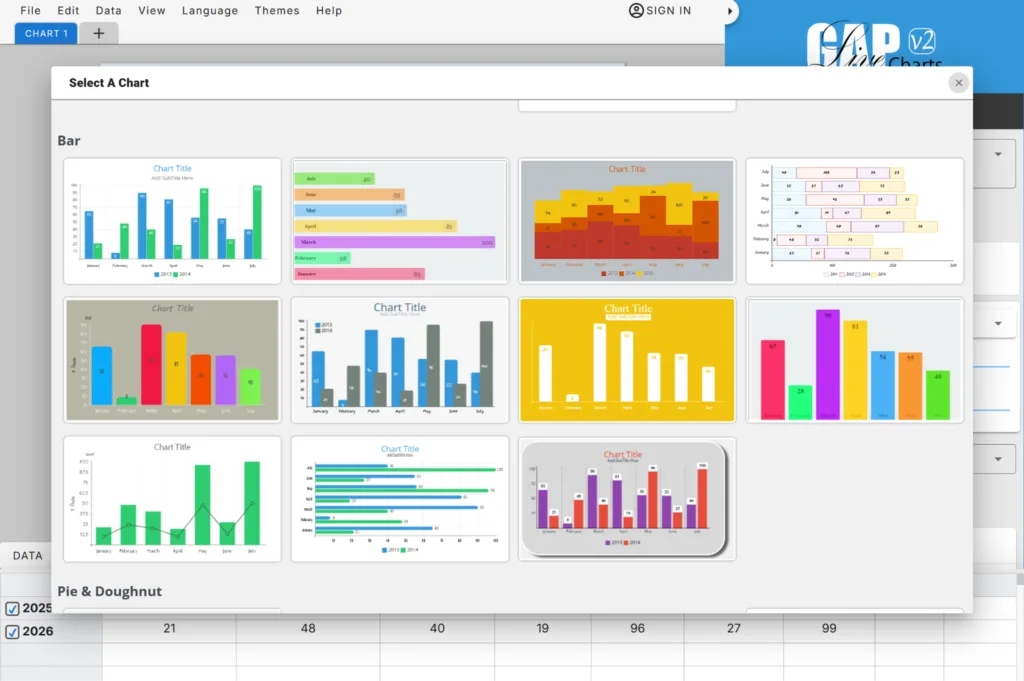
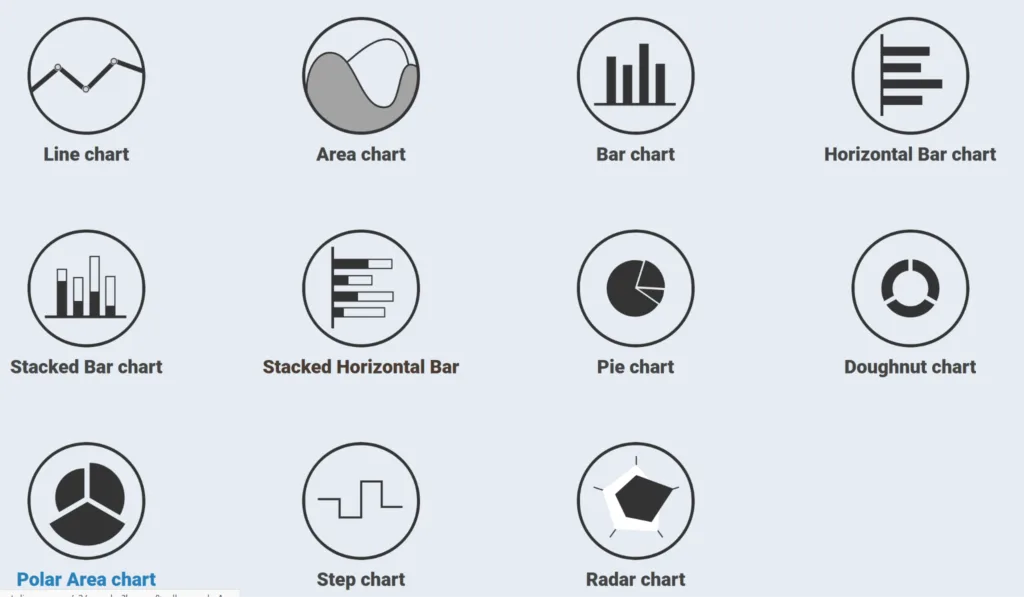
- Wide Variety of Chart Types: Choose from line charts, bar charts, stacked bars, radar, polar area, pie, doughnut, and even icon-based charts. This flexibility ensures your data looks exactly how you want it.
Import Your Data Easily
One of the most powerful features of Livegap Charts is the ability to import your data directly. You can copy and paste data from Excel or CSV files, or upload them, saving time and reducing errors. This makes it perfect for teachers managing grades, businesses tracking sales, or analysts presenting reports.
Make Your Charts Stand Out
Livegap Charts isn’t just about creating basic graphs. It offers customization options that make your charts visually appealing:
- Colors & Fonts: Choose colors and fonts that match your presentation or brand identity.
- Icons: Add icons to make your data more engaging and easier to understand.
- Responsive Design: Charts look great on any device, whether it’s a desktop, tablet, or smartphone.
Use It Anywhere
Because it’s fully online, Livegap Charts works wherever you are. There’s no need to install software or worry about compatibility. Whether you’re working from the office, a classroom, or on the go, you can access your charts anytime, anywhere.
Why Real Users Love It
Thousands of users worldwide rely on Livegap Charts every day for their projects. Its simplicity, speed, and versatility make it a favorite among students, educators, and professionals alike. Feedback highlights how much users appreciate the time saved and the professional quality of the charts.
Get Started Today
Creating charts doesn’t have to be difficult or expensive. With Livegap Charts, you can turn raw data into visually appealing charts in just a few clicks. Whether you’re creating a business report, a classroom presentation, or a personal project, Livegap Charts helps you communicate your data clearly and effectively.
Start exploring Livegap Charts now, no registration, no cost, just beautiful charts. Visit charts.livegap.com and bring your data to life today.